Headder AdSence

🧱 Module 3: Create Your First dbt Project and Connect to a Data Warehouse

📘 Introduction

Now that dbt CLI is installed, it’s time to create your first dbt project. In this module, you’ll:

  • Initialize a dbt project

  • Connect it to a data warehouse (we’ll use Snowflake or PostgreSQL)

  • Understand the project folder structure

  • Create and run your first model

Let’s dive in and turn raw data into analytics-ready models using just SQL.


🧰 What You’ll Need

  • dbt CLI installed (dbt --version)

  • Access to Snowflake or Postgres (other adapters also work)

  • Terminal or command prompt

  • Basic SQL knowledge


🚀 Step-by-Step: Create a dbt Project


🔹 Step 1: Initialize Your Project

In terminal or CMD, navigate to your workspace and run: 


dbt init my_dbt_project

Replace my_dbt_project with your preferred name.

🔹 Step 2: Choose Your Adapter

During the init process, dbt will ask you to choose a warehouse adapter.

For example:

  • snowflake for Snowflake

  • postgres for PostgreSQL

Follow the prompts and confirm project setup.

🔹 Step 3: Understand Project Structure

After setup, you’ll see folders like: 

my_dbt_project/

├── dbt_project.yml      # Project config file

├── models/              # Where your SQL models live

├── snapshots/           # Optional - point-in-time copies

├── seeds/               # Static CSV data files

├── macros/              # Reusable SQL logic (Jinja)

└── target/              # Output folder (autogenerated)

models/ is where you’ll spend most of your time.

🔹 Step 4: Set Up Your Profile

dbt connects to the warehouse using a profiles.yml file.

Location:

  • Windows: C:\Users\<yourname>\.dbt\profiles.yml

  • Mac/Linux: ~/.dbt/profiles.yml

Snowflake Example:

my_dbt_project:

  target: dev

  outputs:

    dev:

      type: snowflake

      account: your_account

      user: your_user

      password: your_password

      role: your_role

      database: your_database

      warehouse: your_warehouse

      schema: analytics

      threads: 1

Postgres Example:

my_dbt_project:
  target: dev
  outputs:
    dev:
      type: postgres
      host: localhost
      user: your_user
      password: your_password
      port: 5432
      dbname: your_db
      schema: analytics
      threads: 1

🔹 Step 5: Test the Connection

Inside your project folder, run:

dbt debug

✅ You should see:
All checks passed! Connection is working.


🔹 Step 6: Create and Run Your First Model

Create a file:
📄 models/first_model.sql

Paste this simple model:

SELECT 1 AS id, 'dbt works!' AS message

Run your model:
dbt run

🎉 That’s it! Your first model is live in your data warehouse.


💡 Pro Tips

  • Keep models small and modular — one concept per file

  • Use Jinja templating for dynamic logic (we’ll cover this in Module 4)

  • Use dbt run --select model_name to run individual models


📌 What’s Next?

📍 Next Module: Create Modular dbt Models Using SQL + Jinja
You’ll learn to layer models and add reusable SQL logic with Jinja templating.
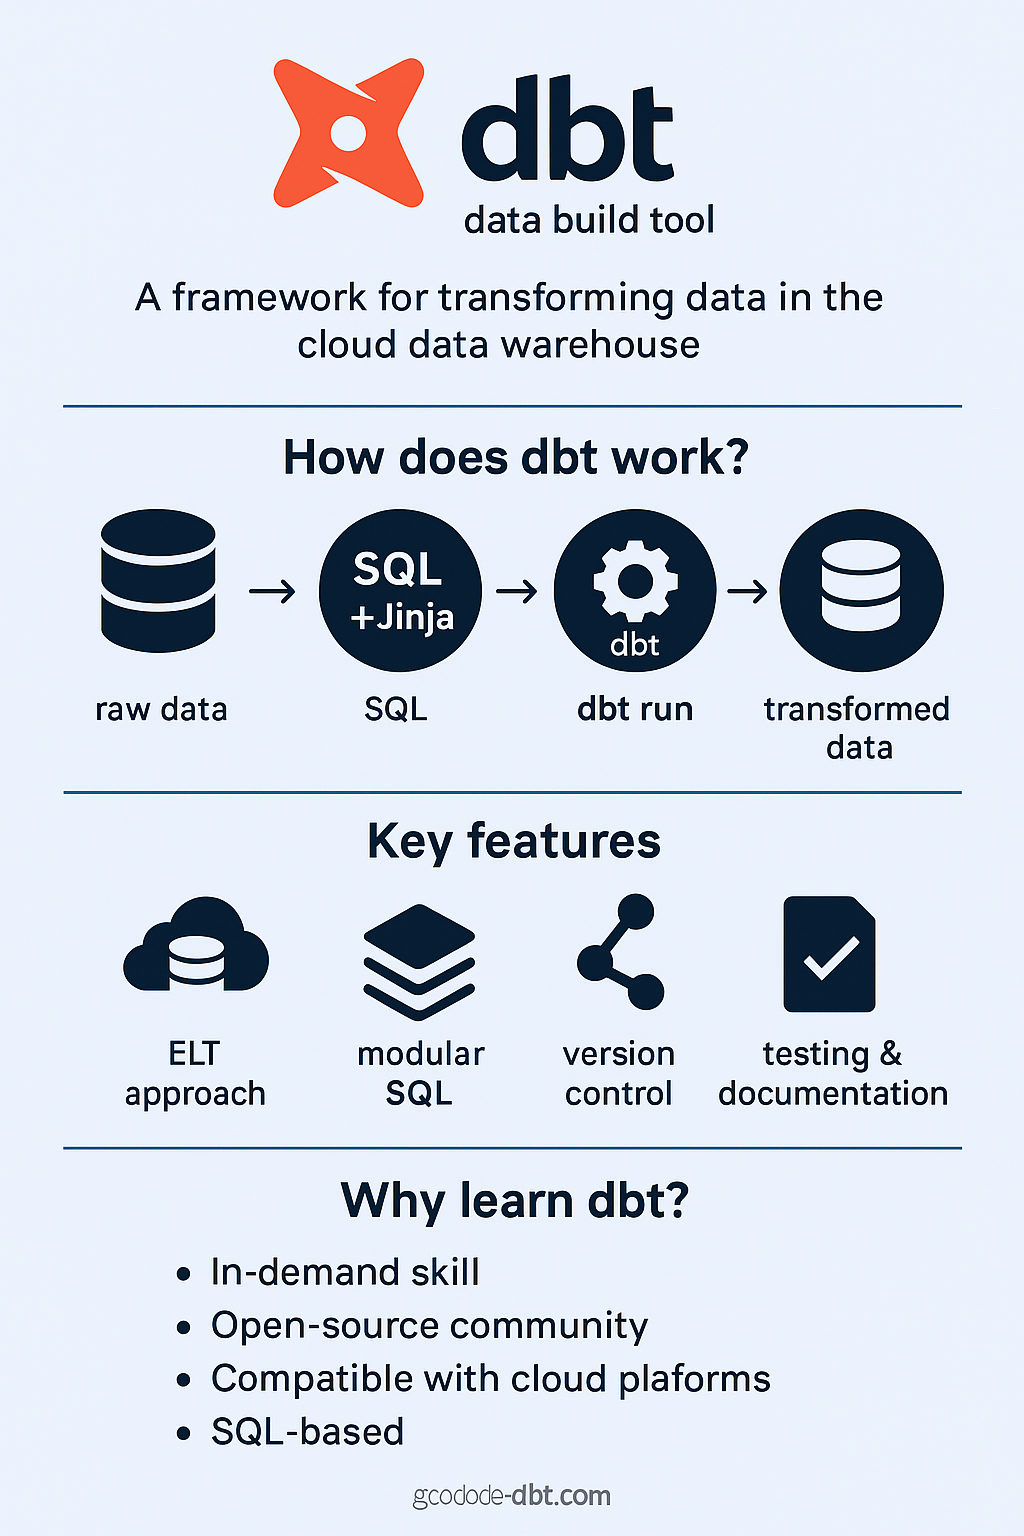
📝 Module 1: What Is dbt and Why Should You Learn It in 2025?

What Is dbt? A Beginner’s Guide to Modern Data Transformation in 2025

🧠 Introduction

If you're a data engineer, analyst, or BI developer wondering how to stay relevant in the fast-changing data world, dbt (data build tool) is the tool you need to know. It’s cloud-native, developer-friendly, and built to transform raw data into trusted, analytics-ready datasets — with just SQL and a touch of Jinja.

This module introduces you to what dbt is, why it's different from traditional ETL tools like SSIS or Informatica, and how it fits into the modern data stack.


🚀 What Is dbt?

dbt = Transform + Test + Document your data using only SQL.

  • It’s an ELT (not ETL) framework: Load first, transform later.
  • Works with modern cloud warehouses: Snowflake, BigQuery, Redshift, Databricks, etc.
  • Uses modular SQL models that build on top of each other.
  • Integrates easily with version control (Git) and CI/CD.
  • Offers built-in testing, documentation, and lineage visualization.

🔧 What Makes dbt Different?

Feature

Traditional ETL

dbt

Tech

GUI or scripts

SQL + Jinja

Code reuse

Limited

Modular, reusable models

Deployment

On-premise or heavy cloud

Lightweight CLI or dbt Cloud

Version Control

Manual or complex

Git-native

Testing

Manual

Built-in

Documentation

External

Auto-generated

Community

Closed

Huge open-source community


🏗️ dbt Workflow (Simplified)

  1. Write modular SQL in /models
  2. Use Jinja to parameterize and reuse logic
  3. Run dbt run to execute transformations
  4. Add dbt test to validate data
  5. Use dbt docs to auto-generate project documentation

🎯 Why Learn dbt in 2025?

  • 🔥 Industry trend: dbt is a key tool in the modern data stack
  • 📈 Career boost: Increasingly required in data engineering & analytics roles
  • 🧱 Open standard: Works with most modern warehouses (Snowflake, BQ, Redshift)
  • 🤖 Compatible with AI tools: Easy to automate with Copilot, ChatGPT, etc.

📘 Real-World Use Cases

  • Create a sales dashboard model for Power BI
  • Build modular KPI layers like revenue, churn, retention
  • Apply data quality checks with dbt test
  • Auto-generate lineage graphs for compliance and visibility

💡 Pro Tip for Beginners

You don’t need to be a Python expert or DevOps guru. If you know basic SQL, you can start using dbt today.


📌 What’s Next?

📍 Next Module: Installing dbt CLI on Your System (Windows, Mac, Linux)
We’ll set up your first dbt project and walk through the folder structure.


dbt vs SSIS: Which ETL Tool Should You Learn in 2025?

🧠 Introduction

As the data world rapidly shifts to the cloud, traditional tools like SSIS (SQL Server Integration Services) are being challenged by newer, modern frameworks like dbt (data build tool). If you're wondering which one to invest your time in for 2025 and beyond — this post will break it down for you.

Whether you're a BI developer, data engineer, or transitioning from on-prem to cloud, here's a clear comparison of dbt vs SSIS — including strengths, weaknesses, use cases, and career impact.


🔍 What Is SSIS?

SSIS is a visual, on-premise ETL tool from Microsoft, widely used in enterprise environments for:

  • Data extraction, transformation, and loading

  • Workflow orchestration

  • Integration with SQL Server

💡 Best for: On-premise systems, legacy SQL Server-based BI environments


🔍 What Is dbt?

dbt is a modern, open-source ELT framework that helps you transform raw data into models using SQL — in the cloud.

  • Built for modern warehouses like Snowflake, BigQuery, Redshift

  • Uses SQL + Jinja templating

  • Follows software engineering best practices (CI/CD, versioning, modularity)

💡 Best for: Cloud data engineering, analytics engineering, modern stack


⚖️ dbt vs SSIS: Feature Comparison

FeaturedbtSSIS
Tool TypeELT (Transform)ETL (Extract → Transform → Load)
UICode-first (SQL + Jinja)GUI-based drag-and-drop
DeploymentCloud-nativeOn-premise (mostly)
PerformanceScales with cloud warehouseLimited to server setup
Version ControlGit-nativeDifficult to manage
CommunityLarge & fast-growingMature but shrinking
Learning CurveSteeper (SQL + CLI)Easier for beginners
Schedulingdbt Cloud, Airflow, CI/CDSQL Server Agent
CostOpen-source, SaaS (paid)Comes with SQL Server license

🎯 Use Case Examples

  • Use SSIS if:

    • You’re heavily invested in Microsoft SQL Server

    • Your data isn’t moving to the cloud yet

    • You’re dealing with file-based ETL or flat file loads

  • Use dbt if:

    • You’re working with Snowflake, BigQuery, Redshift

    • You want reproducible, testable, version-controlled transformations

    • You need scalable, cloud-first architecture


📈 Career Impact: Which Should You Learn in 2025?

RoleRecommendation
BI Developer (MS Stack)Learn both, start adding dbt
Cloud Data Engineerdbt is must-know
Legacy SSIS DeveloperTime to upskill into dbt
Entry-Level EngineerStart with dbt — future-proof your skills

🔥 Tip: Knowing both makes you a highly versatile hybrid BI/Data Engineer.


💡 Pro Tips

  • You can modernize SSIS pipelines using Azure Data Factory + dbt

  • Use dbt with Git + dbt Cloud for production-scale deployments

  • Combine dbt + orchestration tools like Airflow, Prefect, or Azure Data Factory for full control


🧭 Conclusion

In 2025, SSIS is still useful in legacy systems, but dbt is the future of data transformation. If you're planning to grow in the cloud data space, learning dbt is not optional — it’s essential.

Start with dbt's CLI, try a Snowflake model, and build your way toward modern data engineering.

Transform Data Visually in Azure Synapse Using Data Flows (No-Code Guide)


🎯 What You’ll Learn

In this module, you’ll:

  • Understand what Data Flows are in Synapse

  • Create a new Data Flow and link it to a pipeline

  • Add transformations like filters, derived columns, joins

  • Test and monitor the transformation step


🧠 What Are Data Flows in Synapse?

Data Flows are like the "Power Query" of Azure Synapse. They let you:

  • Clean, shape, and enrich data visually (no code needed)

  • Apply logic like filters, joins, conditional columns

  • Transform big data at scale using Spark behind the scenes


🛠️ Step-by-Step: Build Your First Data Flow


🔹 Step 1: Go to Synapse Studio → Orchestration

  • Navigate to "Integrate" → + New → Data Flow

  • Name it TransformCustomerData

📸 Image Tip: Show blank data flow canvas


🔹 Step 2: Add a Source

  • Click + Add Source

  • Choose or create a dataset (e.g., Blob, SQL Table)

  • Configure schema and sampling


🔹 Step 3: Add Transformations

  • From the top bar:
    ➕ Click Add transformation
    Choose one of the following:

TransformationUse Case
FilterRemove unwanted rows
Derived ColumnAdd a calculated field
SelectDrop columns
JoinMerge with another dataset
Conditional SplitApply logic like IF-ELSE
AggregateGroup by and summarize data

📸 Image Tip: Transformation path visual (source → filter → sink)


🔹 Step 4: Add a Sink (Destination)

  • Choose or create a new dataset (e.g., SQL table, CSV, etc.)

  • Map columns from source to sink


🔹 Step 5: Debug and Preview

  • Use the Debug button to run and preview rows

  • Check how transformations affect your data


🔹 Step 6: Add This Data Flow to Your Pipeline

  • Go back to your existing pipeline

  • Drag in the Data Flow Activity

  • Link it to the data flow you just created

✅ Now your pipeline includes transformation logic before loading data!


💡 Pro Tips

  • You can chain multiple transformations

  • Use expressions (like iif(condition, result1, result2)) for custom logic

  • Use caching to test small batches without rerunning the full flow

How to Set Up Your Azure Synapse Analytics Workspace (Beginner Guide – 2025)


🧠 What You’ll Learn

In this module, you'll learn:

  • What Azure Synapse is

  • How to create a Synapse workspace step-by-step

  • How to configure linked services (SQL, Blob, etc.)

  • Key setup tips for new users


💡 What is Azure Synapse Analytics?

Azure Synapse is Microsoft’s unified platform for data integration, warehousing, and big data analytics. It combines SQL-based data warehousing with Apache Spark, Data Lake, and powerful ETL pipelines — all in one place.


🧱 Step-by-Step: Create a Synapse Workspace

🧩 Step 1: Go to Azure Portal

🧾 Step 2: Fill Workspace Details

  • Resource group: Create or select one

  • Workspace name: Example – synapse-data-pipeline

  • Region: Choose the one nearest to your users

  • Data Lake Storage Gen2: Choose or create a new Storage Account and container (file system)

Pro Tip: Keep naming consistent across services for clarity.

🔐 Step 3: Review Security Settings

  • Set up Managed Identity

  • Optionally configure Networking and Firewall Rules

🚀 Step 4: Click “Review + Create” → Then “Create”

⏱ It will take 1–3 minutes to deploy.

📸 Image Tip: Include a screenshot of the “Create Synapse Workspace” form.


🔗 Connect Linked Services (Data Sources)

Once your workspace is ready:

  1. Open Azure Synapse Studio (from portal or workspace link)

  2. Go to Manage > Linked Services

  3. Click + New and select a source (e.g., Azure SQL, Blob, etc.)

  4. Enter credentials or use Managed Identity

  5. Test connection → Create

Use linked services to bring in data sources securely.

📸 Image Tip: Linked service creation screen in Synapse Studio


⚙️ Initial Configuration Tips

  • Set up Integration Runtimes for copy/move operations

  • Configure Apache Spark pool if you plan to run big data workloads

  • Turn on Git Integration if using version control (optional but useful)


📌 What’s Next?

In the next module, we’ll build your first data pipeline in Synapse using the GUI.

📍 Next Up: Module 3 — Build Your First Synapse Data Pipeline

Modern Data Engineering: A Beginner’s Introduction (2025 Edition)


🧠 What You’ll Learn

In this module, you'll get a clear understanding of:

  • What Data Engineering is

  • Why it matters in modern businesses

  • Key tools & technologies (Azure Synapse, Power BI, Snowflake, dbt, etc.)

  • Real-world use cases

  • What you'll build in this course


🔍 What is Data Engineering?

Data Engineering is the practice of designing, building, and maintaining systems that collect, process, and store data for analysis. Think of it as the plumbing that brings clean, usable data to decision-makers, dashboards, and data scientists.


🧱 Key Responsibilities of a Data Engineer

  • Build ETL/ELT pipelines (Extract, Transform, Load)

  • Create and manage data warehouses and data lakes

  • Ensure data quality, governance, and security

  • Optimize for performance and cost

  • Work with tools like SQL, Python, Spark, Azure, Snowflake


🚀 Why is Data Engineering So Important in 2025?

  • The explosion of data from apps, IoT, AI, and automation

  • Demand for real-time decision-making

  • Every business wants insights, and they need clean, fast data

  • Power BI, Tableau, and AI tools are only as good as the data behind them


🛠️ Popular Data Engineering Tools You’ll Learn in This Course

ToolPurpose
Azure SynapseCloud-based data integration + analytics
Power BIData visualization and reporting
Azure Data FactoryVisual ETL pipeline builder
SnowflakeScalable cloud data warehouse
dbtSQL-based data transformation
ChatGPT / CopilotBoost productivity using AI for SQL, scripts, logic

🗺️ Real-World Use Case (Preview of Course Project)

Imagine you work for a retail company. You need to:

  • Collect daily sales from multiple sources

  • Clean and transform that data

  • Store it in a centralized data warehouse

  • Visualize KPIs in Power BI

  • Automate it all to run daily

That’s what we’ll build, step by step.


🔄 What You’ll Build in This Course

  • Create an Azure Synapse workspace

  • Build ETL pipelines using Synapse + ADF

  • Connect Power BI to your Synapse dataset

  • Use DAX to build KPIs like revenue, profit, and ranking

  • Optimize Snowflake queries

  • Use ChatGPT to accelerate development

  • Deliver a final dashboard with automated pipelines


🎯 Who Is This For?

This course is for:

  • Aspiring Data Engineers

  • Power BI Developers who want backend skills

  • SQL professionals looking to enter the cloud space

  • Anyone who wants a structured way to learn modern BI

Power BI DAX for Beginners: 10 Essential Formulas You Should Know


🔟 Top 10 DAX Formulas (with examples):

FormulaPurposeExample
SUM()Adds up column valuesSUM(Sales[Amount])
AVERAGE()Mean valueAVERAGE(Orders[Quantity])
COUNTROWS()Count of rows in tableCOUNTROWS(Customers)
CALCULATE()Applies filtersCALCULATE(SUM(Sales[Amount]), Region = "West")
FILTER()Returns filtered tableFILTER(Orders, Orders[Quantity] > 10)
IF()Logical conditionIF(Sales[Amount] > 1000, "High", "Low")
RELATED()Bring in data from related tablesRELATED(Product[Category])
ALL()Remove filtersCALCULATE(SUM(Sales[Amount]), ALL(Sales))
RANKX()Rank rowsRANKX(ALL(Sales), Sales[Amount])
DISTINCTCOUNT()Unique values countDISTINCTCOUNT(Customers[CustomerID])

💡 Pro Tips:

  • Use CALCULATE with filters to unlock advanced DAX logic

  • Combine RANKX + FILTER for custom leaderboards

  • ALL and ALLEXCEPT are key for ignoring/reporting filters

📌 Conclusion:

  • DAX is powerful, learn the logic behind each formula

  • Next step: build a mini dashboard using these formulas

How to Build Your First Data Pipeline in Azure Synapse Analytics (2025 Guide)


📝 Introduction

Data pipelines are the backbone of modern data analytics. Azure Synapse Analytics combines big data and data warehousing to help you design, schedule, and manage end-to-end pipelines — all from a single interface.

In this beginner-friendly guide, you'll learn how to build your first pipeline in Synapse — from setting up your workspace to executing your data flow — all with screenshots and code snippets.


🚀 Step-by-Step Guide: Build Your First Synapse Pipeline


🧩 Step 1: Set Up Your Synapse Workspace

  1. Go to Azure Portal

  2. Search for Synapse Analytics → Click + Create

  3. Fill in:

    • Workspace name

    • Subscription & resource group

    • Storage account & file system name

  4. Click Review + Create → then Create

🖼️ Image Prompt: Azure Synapse workspace creation page


🔌 Step 2: Connect a Data Source

  1. Go to ManageLinked services

  2. Add a new source (e.g., Azure SQL Database, Blob Storage)

  3. Fill connection details, test & save

💡 Tip: Always use managed identities where possible for better security

🖼️ Image Prompt: Linked services configuration screenshot


🔄 Step 3: Create a Pipeline

  1. Go to Integrate → Click + Pipeline

  2. Drag and drop Copy Data activity

  3. Choose your source and sink (destination) datasets

  4. Configure mapping, if needed

🧠 Best Practice: Use dataset parameters for reusability


💧 Step 4: Add a Data Flow (Optional)

  1. Click + Add Data Flow

  2. In the data flow canvas, add Source, Transformation, and Sink

  3. Configure schema mappings, filters, expressions

  4. Debug and test the flow

🧪 Sample expression: iif(isNull(column), 'NA', column)

🖼️ Image Prompt: Simple Synapse Data Flow visual


🕒 Step 5: Trigger and Monitor the Pipeline

  1. Click Add TriggerNew/Edit

  2. Choose Manual or Scheduled

  3. Click Publish All

  4. Go to Monitor tab to check execution status

🖼️ Image Prompt: Synapse pipeline monitor tab with successful run


🎓 Pro Tips for Beginners

  • 💡 Use the ‘Debug’ feature to test without full execution

  • 🚦 Use conditional splits in data flows to handle data quality

  • 🔐 Secure linked services with Azure Key Vault

  • 🔁 Reuse pipelines using global parameters


Conclusion

You’ve now created your first Azure Synapse pipeline — a vital step toward building enterprise-ready analytics solutions. As you grow, explore advanced tasks like parameterization, CI/CD, and data lake integration.

how to create a worksheet in snowflake and rename sheet

    Creating a worksheet in the Snowflake GUI (Graphical User Interface) is a straightforward process that allows you to run SQL queries and interact with your data. 

Here's how you can create a worksheet and rename it:

Creating a Worksheet: YouTube Link

Login to Snowflake:
Access the Snowflake web interface by logging into your Snowflake account.

Navigate to Worksheets:
    In the left sidebar, you'll find a menu. Click on "Worksheet" under the "SQL" section.

Open a New Worksheet:
        Once you're in the "Worksheet" section, you can see a list of existing worksheets if any. To create a new worksheet, click the "New Worksheet" button.

Write and Execute SQL:

    In the newly opened worksheet, you'll find an SQL editor where you can write your SQL queries. Write your query and click the "Run" button (usually represented by a play icon) to execute the query.

Renaming a Worksheet:

Worksheet Tabs:

    In the top area of the worksheet interface, you'll see tabs representing each open worksheet. The default name for a new worksheet is often "Worksheet 1" or similar.

Right-Click the Tab:

    To rename the worksheet, right-click on the tab of the worksheet you want to rename. This action will typically open a context menu.

Enter New Name:
    
        After selecting "Rename," the tab name will become editable. Enter the desired name for the worksheet.

Confirm the Name:

        Press "Enter" or click outside the renamed area to confirm the new name for the worksheet. The tab should now display the new name you entered.

Note: Keep in mind that specific features and layout might vary slightly depending on updates and the version of the Snowflake user interface you are using. The steps provided should be generally applicable to most versions of Snowflake's web interface.


Remember that worksheets are useful for running queries and interacting with your data, but they are typically not meant for long-term storage of queries or results. For more organized storage and sharing of SQL scripts and results, consider using Snowflake's scripts, notebooks, or other relevant features based on your use case.